

Inside this article
- Selling continued after the opening gap
- The 50-day SMA broke on high volume
- Expected-move levels and the 200-day SMA
Q3 2026 review · October 22 intraday snapshot
Q3 2026 post-earnings review · October 22, 2026 · Intraday update
Meta beat on revenue, but the price action kept getting worse after the opening gap down. That is the part of this earnings reaction I am paying attention to.
My October 22 thinkorswim screenshot shows META at $645.01, down $52.51, or 7.53%, from Wednesday's $697.52 close. The stock opened at $676.35, already down about 3%. It then lost another $31.34, or 4.63%, from the open. At the time of the screenshot, META was only $0.71 above its $644.30 session low.
META broke the 50-day simple moving average—a critical support zone—on high volume, and the selling continued instead of attracting a sustained buy-the-dip response. That combination is the bearish signal I am watching. A gap down can recover. A gap down that keeps selling through support tells me sellers still have control.
These are the prices in my screenshot, not closing prices or a live quote.
The opening gap was only the beginning
Here is the sequence from the chart:
- Wednesday close: $697.52. This is the reference price for the earnings reaction.
- Thursday open: $676.35. The opening gap was $21.17 lower, about 3.04%.
- Thursday intraday high: $681.07. That lift had not turned into a lasting recovery by the time of the screenshot.
- Screenshot price: $645.01. The decline had widened to 7.53% from Wednesday's close.
- Session low so far: $644.30. The stock was trading close to that low when I captured the chart.
The distinction matters: the full 7.53% decline was not all an overnight gap. Much of the damage happened after the market opened. Buyers had a chance to defend the stock, and the rebound did not hold.
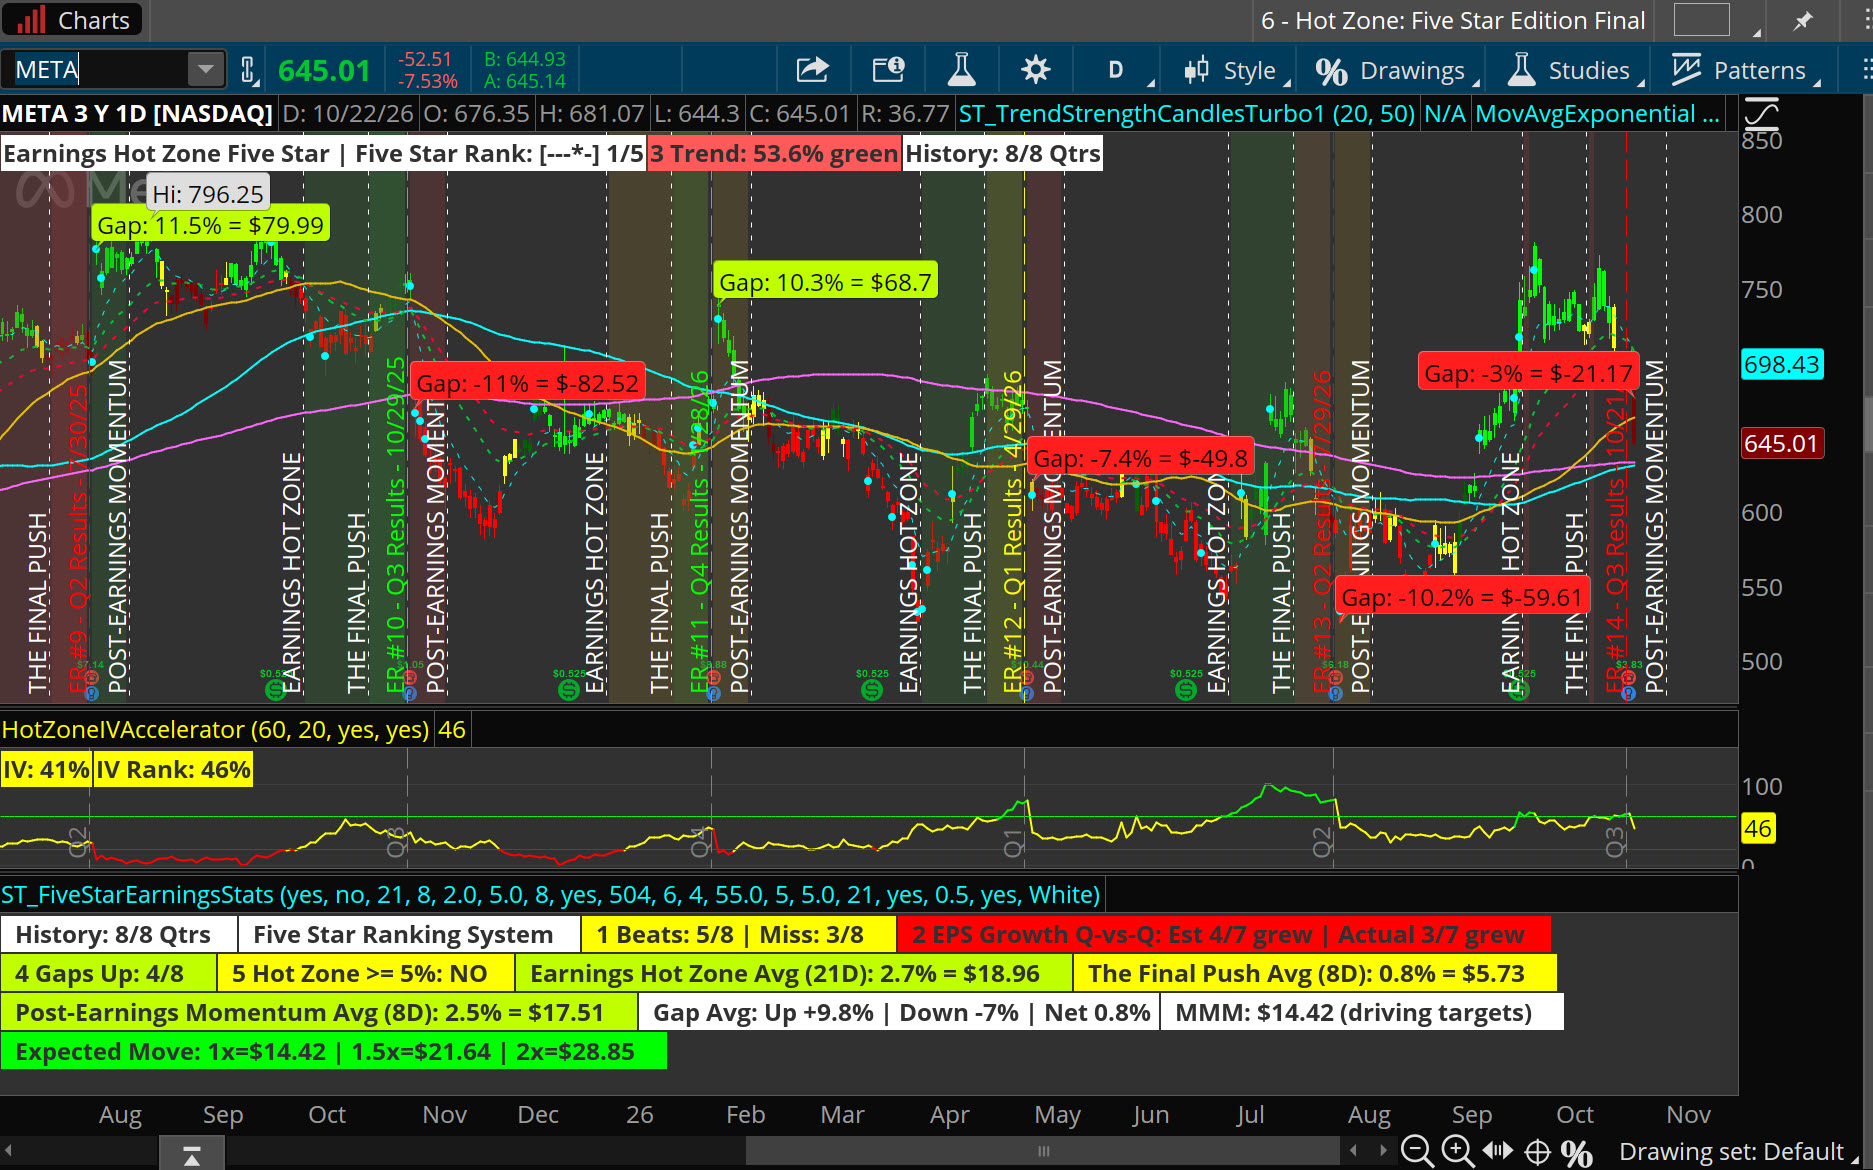
Source: my October 22 thinkorswim screenshot. Select the chart to view it at full size. The high-volume description reflects my observation of the session; this screenshot does not display a share-volume pane.
Why the 50-day SMA break matters
The 50-day SMA was critical support in this setup. The reference level in my pre-report analysis was approximately $661.50. Once META lost that area and then $650, the question changed: would buyers reclaim support, or would the stock keep trading lower?
At the screenshot price, the answer was continued selling. Reaching a level on my chart is not enough to make this a bounce setup. The break of support on high volume, followed by more downside, carries more weight for me than the revenue beat.
My Nasdaq futures screenshot also showed /NQ down about 3%, so this was happening in a weak broader market. My Lam Research screenshot showed another earnings name down roughly 11.3%. That gives the selloff context; it does not erase META's own break of support.
The moving-average references use completed daily closes through October 21: approximately $661.46 for the 50-day SMA and $632.62 for the 200-day SMA. These were recalculated from Yahoo Finance historical prices; they are dated reference levels, not live intraday indicator readings.
The earnings report: growth, a legal charge and a spending question
The reported earnings need context:
- Revenue: $64.60 billion, up 26% year over year. Benzinga's earnings table lists a $63.37 billion revenue estimate.
- Reported diluted EPS: $3.83. Meta recorded a $9.89 billion legal charge tied to its August agreement with 52 attorneys general. The company's calculation excluding the charge and its tax effects puts EPS at $7.40.
- Q4 revenue guidance: $73–76 billion.
- 2026 capital-spending outlook: $135–145 billion, including principal payments on finance leases. The prior range was $130–145 billion.
- 2027 spending: no numerical capex guidance was provided. On the call, CFO Susan Li said more specific guidance would come with the Q4 call, when Meta typically discusses the next year's outlook.
Sources: Meta's Q3 2026 results and outlook, official earnings-call transcript, page 15, and Benzinga's revenue consensus table.
I would not compare the $7.40 figure excluding the charge with a headline EPS estimate and call that a clean beat without checking that both use the same accounting basis. The underlying business and the reported EPS headline tell different parts of the story.
The spending outlook is part of the report, but the price chart cannot establish why each investor sold. My bearish assessment rests on what I can observe: the opening gap, the loss of support and the additional decline during the session.
The expected move: a reference range, not a floor
The saved Options Earnings snapshot from October 21 at 3:33 p.m. Eastern recorded an expected move of $41.16, or 5.85%, with META at approximately $703.49, for the October 23 expiration. Options Earnings calculates this estimate as 85% of the at-the-money call-plus-put premium; the stored straddle was $48.425 at the $702.50 strike.
These are the bands around that snapshot's stock price, calculated using the unrounded saved values. They are not bands centered on the later $697.52 closing price.
- 1× expected move: about $744.65 up / $662.32 down.
- 1.5× expected move: about $765.23 up / $641.74 down.
- 2× expected move: about $785.81 up / $621.16 down.
Source: saved Options Earnings options snapshot and calculation inputs. This replaces the original draft's unverified 6.5% assumption. Different timestamps and calculation methods can produce different expected moves.
Yahoo Finance's one-minute extended-hours data records a $748.80 high at 4:40 p.m. Eastern on October 21. That is above the upper 1× band. The October 22 screenshot shows $645.01, below the lower 1× band and below $650, but still above the lower 1.5× band.
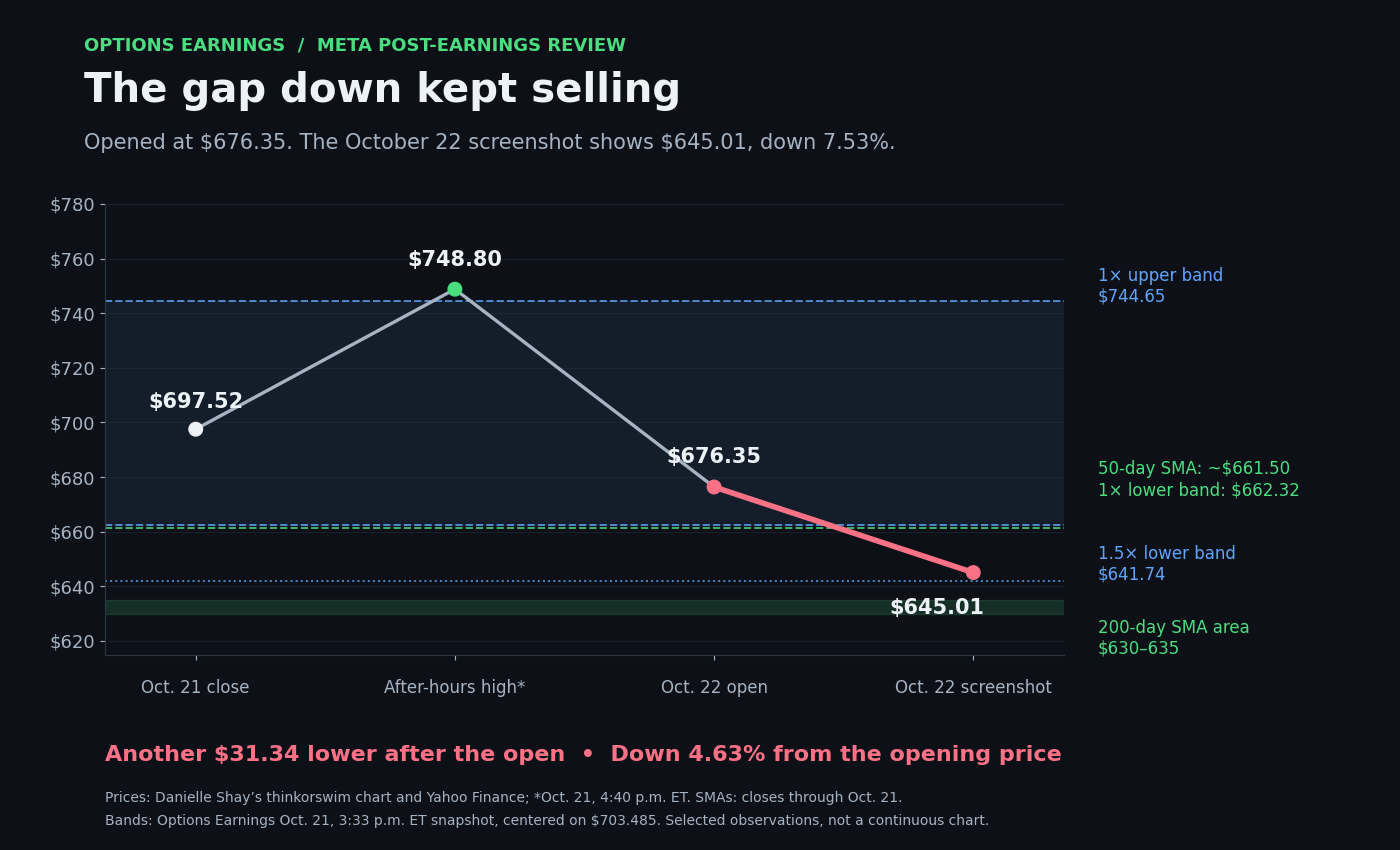
Selected observations, not a continuous intraday chart. The after-hours high was verified against Yahoo Finance data; the open and screenshot price come from thinkorswim. Expected-move bands use the October 21 Options Earnings snapshot centered on $703.485. SMA references use daily closes through October 21.
The screenshot's indicator also displays “MMM: $14.42” and uses it for its expected-move targets. That is the displayed post-report value. It is a different reading from the saved $41.16 pre-report estimate and should not be substituted into this comparison.
My momentum rule—and what actually triggered this bearish read
One of my post-earnings momentum rules looks for a stock to gap 1.5× to 2× its expected move through a key level. The opening gap and the total decline need to be measured separately.
Using the saved $41.16 pre-report expected move as the denominator, and measuring each price change from Wednesday's $697.52 close:
- The $21.17 opening gap was about 0.51× the expected move.
- The $52.51 decline to the screenshot price was about 1.28× the expected move.
- The $51.28 rise to the verified after-hours high was about 1.25× the expected move.
Using that saved estimate, META did not meet the 1.5×–2× opening-gap rule. My bearish read here comes from the high-volume break of the 50-day SMA and $650, and continued selling after the open. The full intraday decline is not the opening gap.
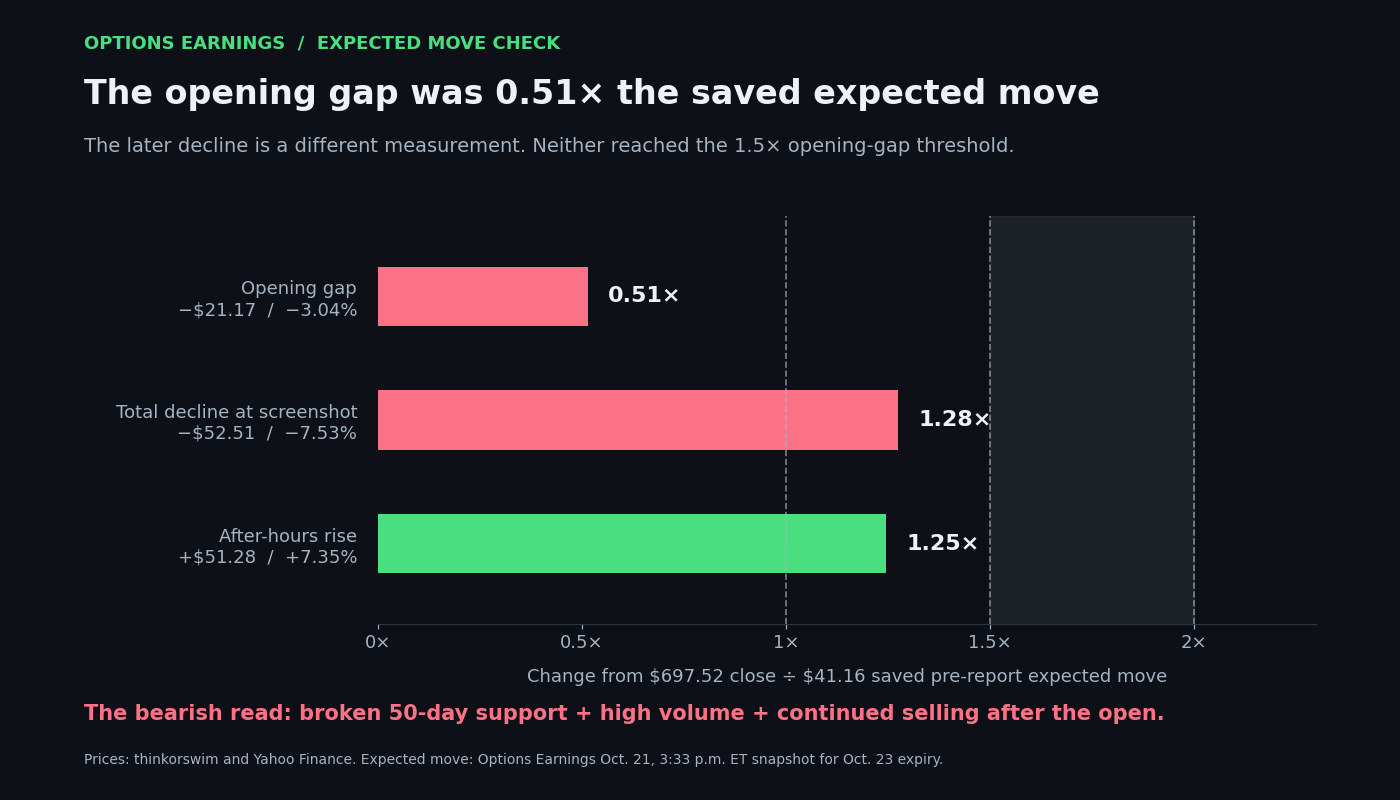
The bands above are centered on the pre-report snapshot price. The bars here measure close-to-price changes divided by the saved expected-move amount. Those are different measurements.
The levels I am watching next
- $650: this round number is the first recovery test I am watching.
- Approximately $661.50–662.32: this combines the dated 50-day SMA reference with the lower 1× band from the saved options snapshot. A sustained reclaim would challenge the bearish read and make me reassess.
- The 1.5× downside band, approximately $641.74: this is the next options-derived reference below the screenshot price.
- The 200-day SMA area, approximately $630–635: this is the lower technical zone in my setup, separate from the $641.74 band. Neither level guarantees a destination or a bounce.
- If the 200-day fails: that would further weaken the recovery from the summer lows. I would reassess the structure rather than assume the first support test has to hold.
For now, I want evidence that buyers can reclaim a broken level. A stock being down a lot is not, by itself, my reason to buy it.
What this teaches us about trading earnings
Map the expected move before the report, then watch how price behaves around critical support. The same percentage decline can tell two different stories: a gap down that buyers absorb, or a gap down that turns into persistent selling.
META is showing the second pattern in this October 22 snapshot. The loss of the 50-day SMA on high volume and the additional selling after the open are what make this review bearish. I will change that view if price gives me a reason to.
For more earnings breakdowns, visit my YouTube channel and the Options Earnings calendar. Get the weekly reports and names I am watching in The Earnings Watchlist.
Educational market commentary, not personalized investment advice. Prices reflect the October 22 screenshot and the dated references described above. Expected moves are estimates, not limits on price movement. Options involve risk.