

Inside this article
- Intel's PC warning broke AMD's 50- and 100-day SMAs
- The expected move, $450 support and the 200-day SMA
- AMD's post-earnings gap history
Q3 2026 preview · November 3, 2026 · Before the report
Q3 2026 earnings preview · November 3, 2026 · AMD reports after the close
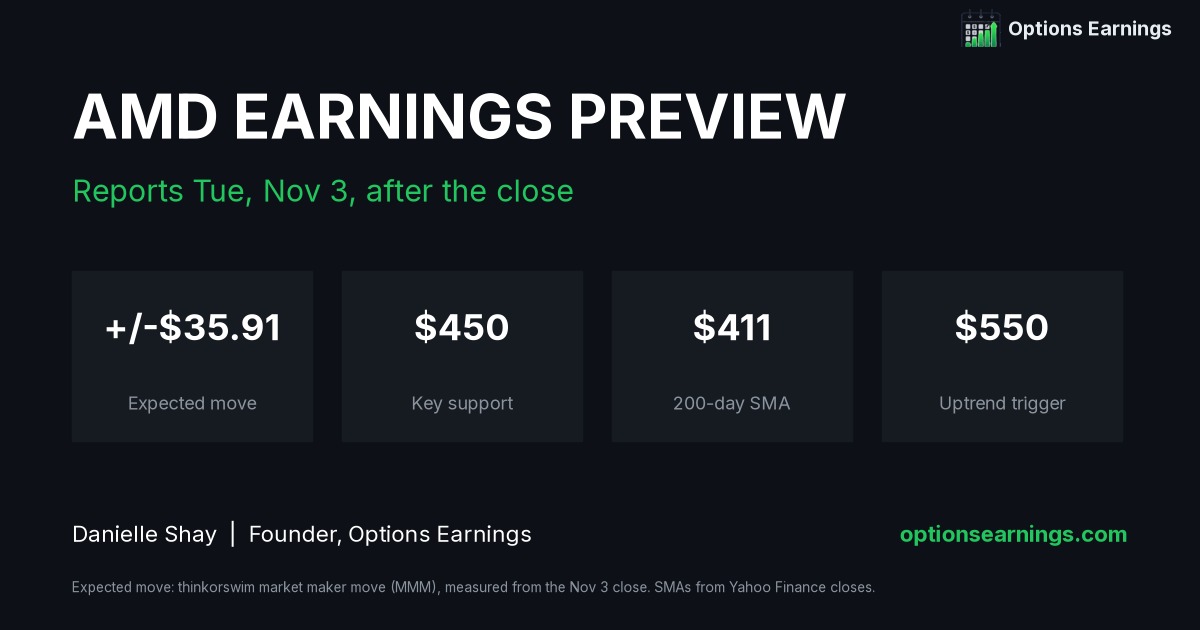
AMD reports earnings tonight, Tuesday, November 3, after the close, and it walks into the report after one of its worst two-day stretches of the year. Intel's PC warning sent AMD down 10.9% on Friday and another 7.5% on Monday, and the selloff broke critical support on heavy volume.
This earnings season is very dicey, as investors are punishing companies for any type of earnings issue. Here is how I'm mapping AMD's expected move, the support zones I'm watching, and why AMD's post-earnings history makes me cautious even though I'm bullish on the fundamentals.
AMD was looking strong until Intel reported
AMD was looking strong until Intel reported, and the PC slowdown sent AMD stock down substantially Friday and Monday. AMD closed at $566.42 on October 29, fell to $504.80 on October 30 and closed at $466.84 on November 2. That is a 17.6% drop in two sessions on another company's earnings.
Intel's report was the most pivotal call of the week, but Intel's overall numbers are more dependent on the PC market than AMD's. PCs are only about 27% of AMD's sales, compared with about half of Intel's. Data center is 58% of AMD's sales and more than doubled last quarter.
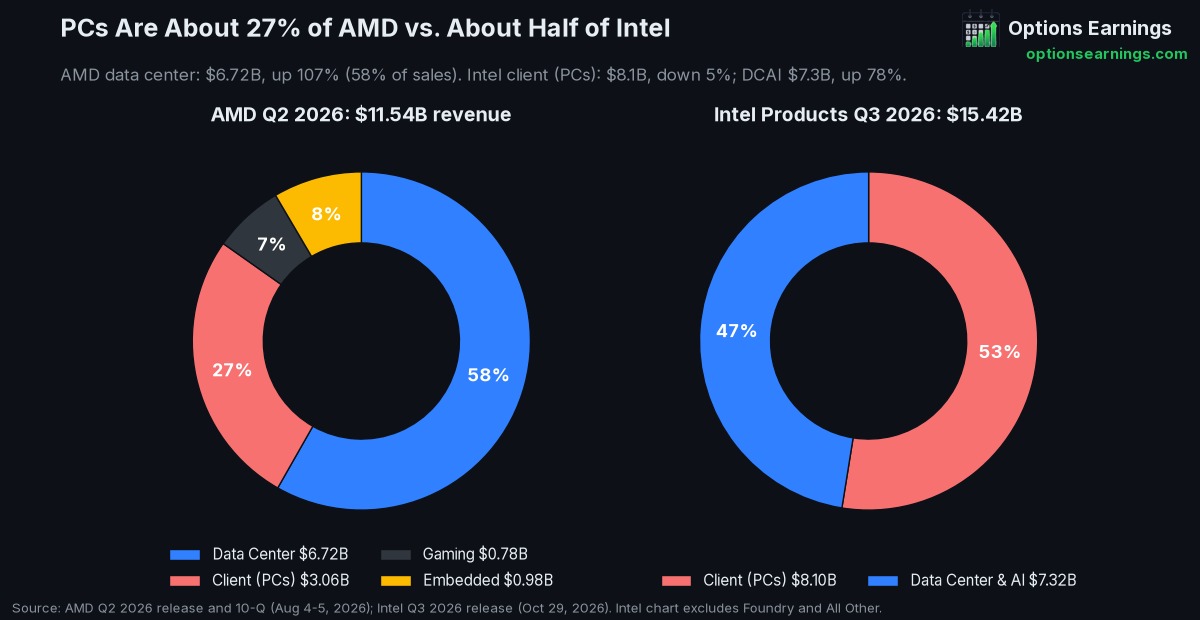
AMD Q2 2026: data center $6.72 billion, up 107%, 58% of sales; client (PCs) $3.06 billion, about 27%. Intel Q3 2026: client (PCs) $8.1 billion, down 5%, about half of $15.4 billion Intel Products revenue; data center and AI $7.3 billion, up 78%. Sources: AMD Q2 2026 earnings release and 10-Q; Intel Q3 2026 earnings release.
While I imagine the PC slowdown will hit AMD as well, the good news is the stock has likely already fallen enough going into the report, so any bad news may be priced in.
The technical breakdown
The issue is the selloff broke the 50- and 100-day SMAs on heavy volume, and when a stock goes into a report on a technical breakdown, it can keep going because it's heavy.
AMD closed below both averages on October 30 on 39.7 million shares, about twice its 50-day average volume of 19.8 million.
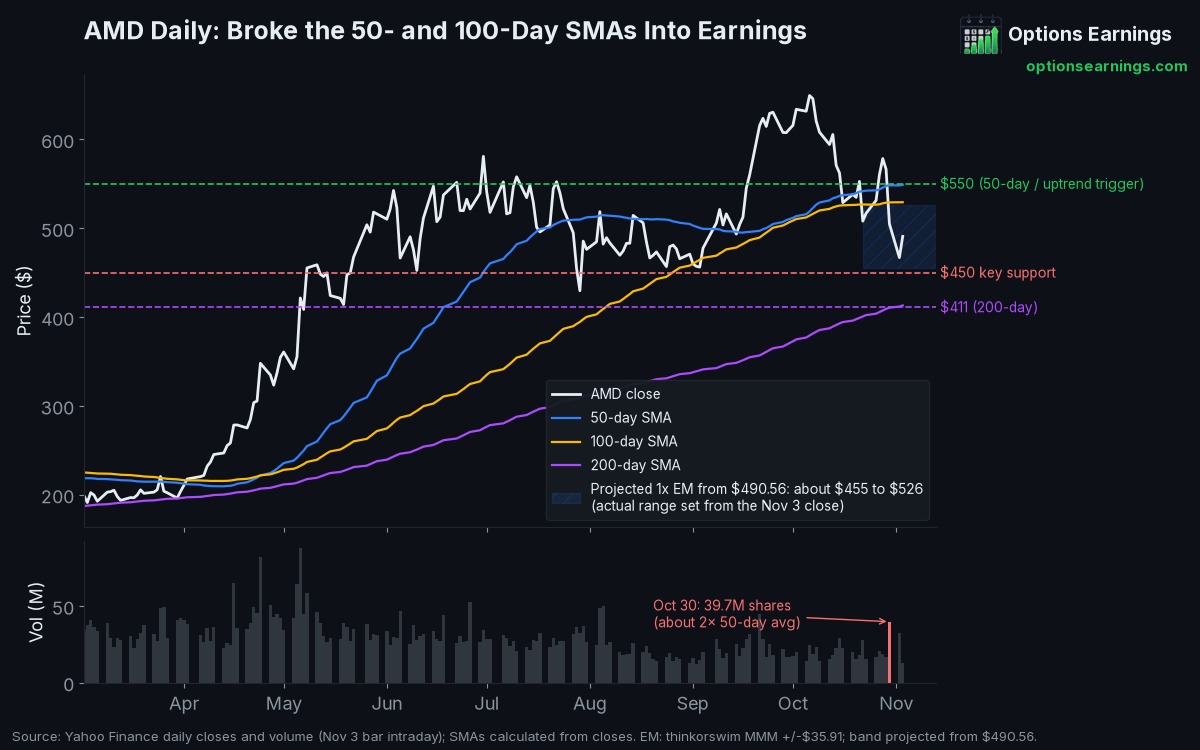
50-day SMA $548.16, 100-day SMA $529.20, 200-day SMA $411.68, calculated from Yahoo Finance daily closes through November 2. The shaded band is a projection from the current price; the actual expected-move range is set from today's close.
The expected move and key levels
AMD has an expected move of about +/-$36 (7.3%) from today's close, the market maker move in thinkorswim. Measured from today's closing price, that is +/-$35.91 at 1x, +/-$53.86 at 1.5x and +/-$71.82 at 2x.
Projected from the current price ($490.56), that works out to about $455 to $526 (1x), $437 to $544 (1.5x) and $419 to $562 (2x). The actual range is set from today's closing print.
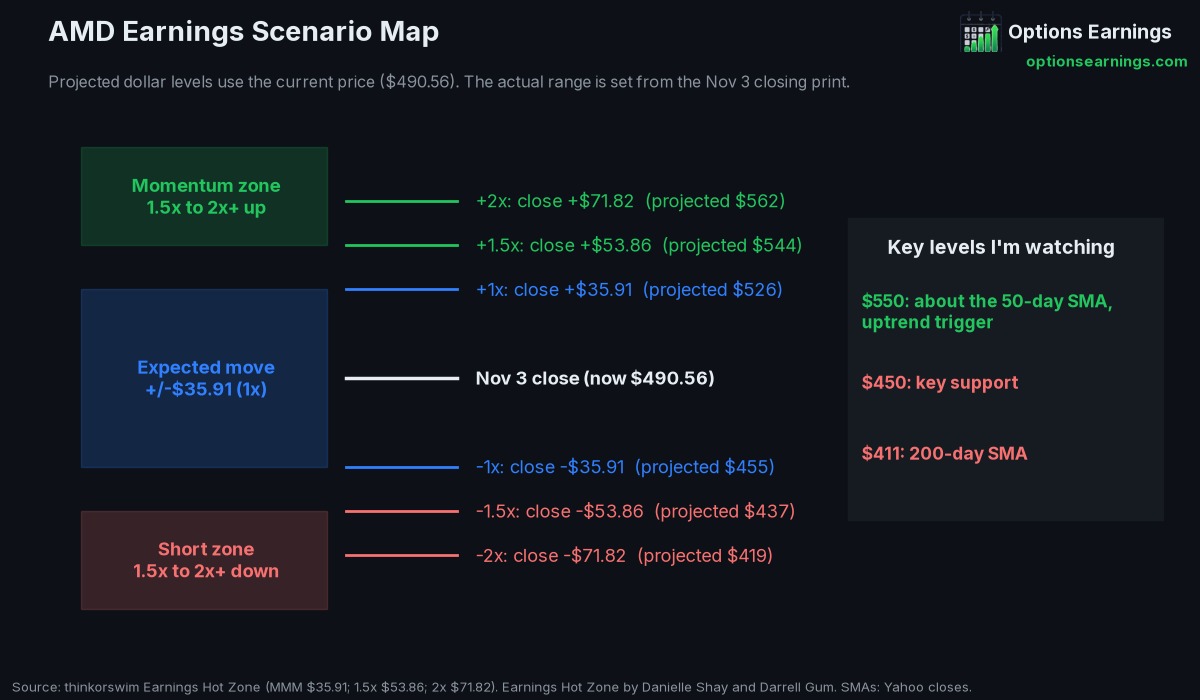
Explore the expected move
Set the reference price. See the ranges.
The $490.56 starting value is the article’s intraday snapshot. Enter the November 3 closing price when it is available.
Uses the 1x, 1.5x, and 2x dollar offsets displayed in Danielle’s November 3 thinkorswim chart. This is an illustration, not a live quote or a limit on the stock’s move.
- $450: Key psychological level and price support.
- 200-day SMA near $411: The next support zone if $450 fails.
- $550, about the 50-day SMA: AMD would need to break this level to resume the uptrend, which would trigger a momentum buy signal.
$450 is key support, and the 200-day is at about $411. I would buy down into either zone. It would need to break $550 to resume the uptrend. At about $490, a move above $550 is outside the expected range, making it unlikely to recover the 50 SMA.
Expected moves are estimates from options pricing, not limits on how far a stock can move.
AMD usually beats, then falls
I'm bullish on AMD fundamentals, but I caution investors because AMD historically falls post-earnings, even though it usually beats. It has beaten EPS estimates 7 straight quarters according to thinkorswim, yet it has gapped down after 6 of its last 8 reports. This is the typical pattern for the stock.
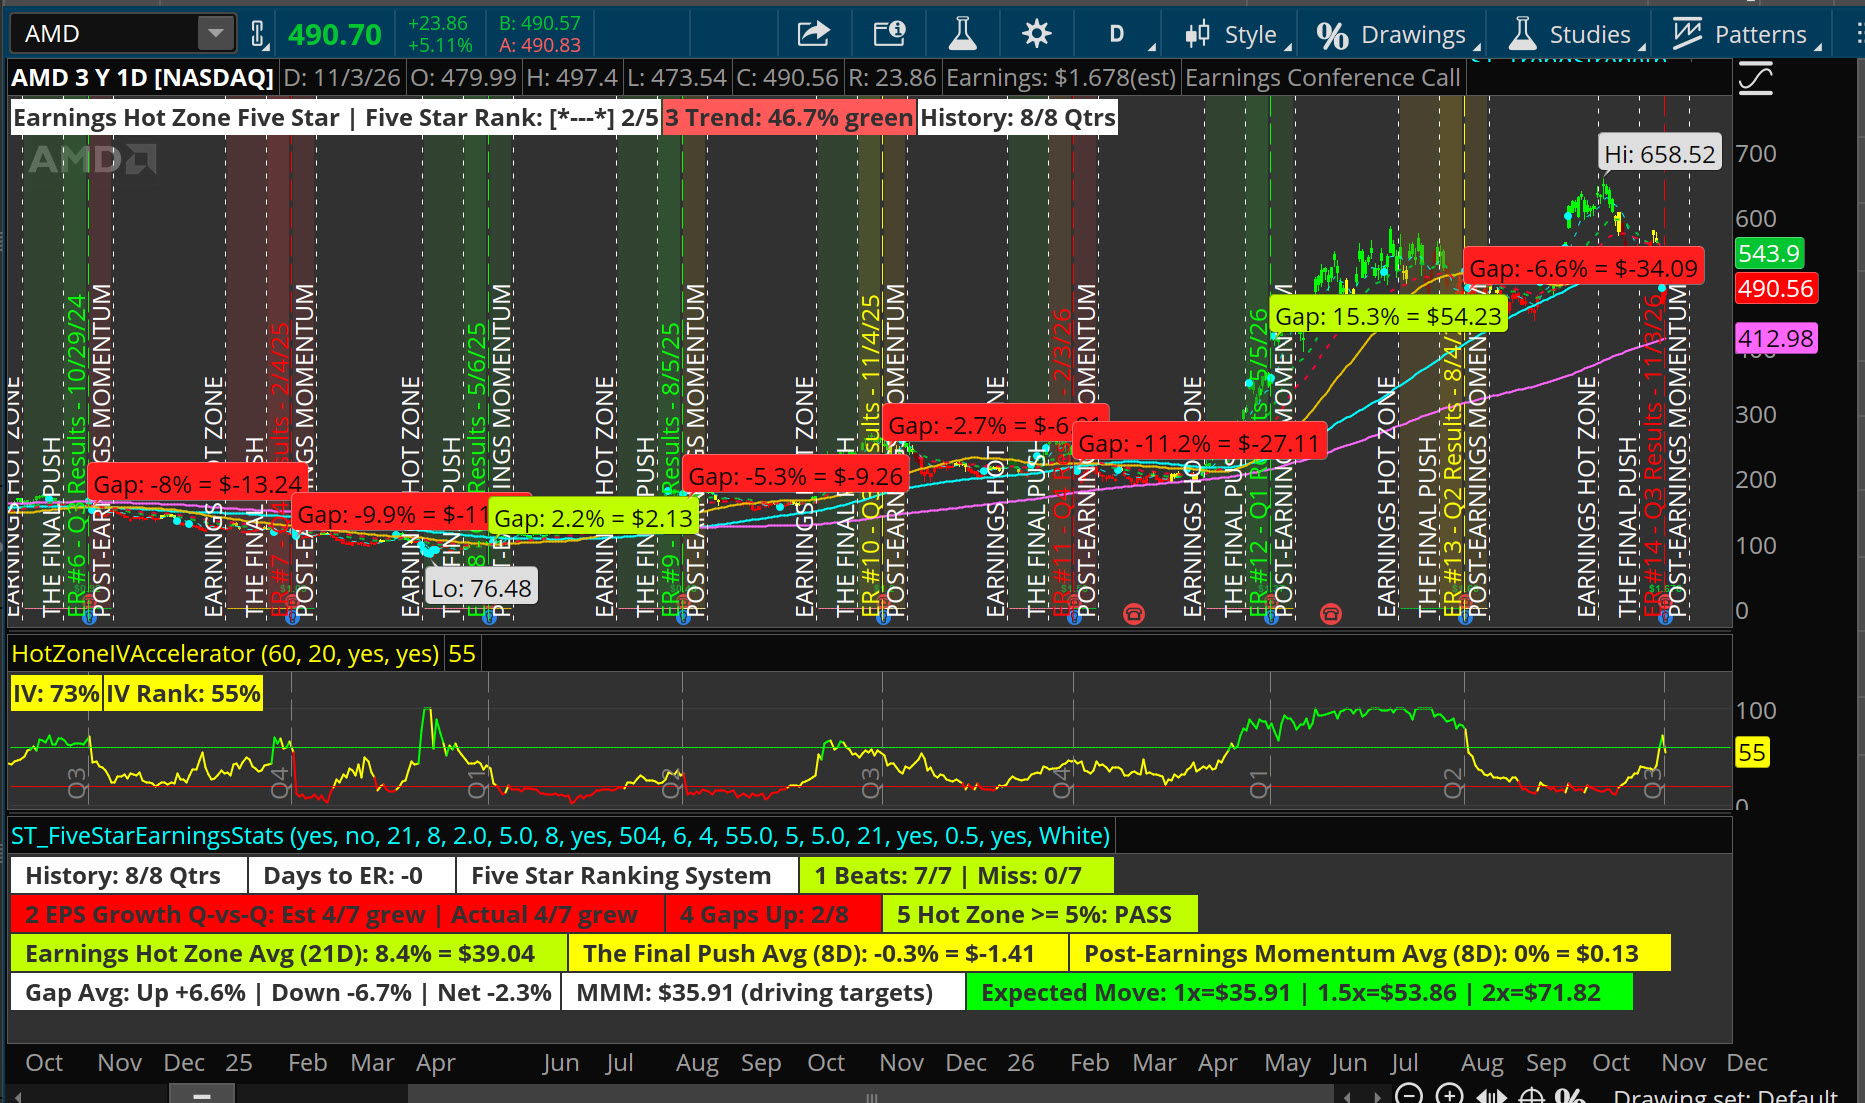
My AMD Earnings Hot Zone chart in thinkorswim, a 3-year daily chart with each earnings gap marked. Earnings Hot Zone is the system my husband, Darrell Gum, and I built together.
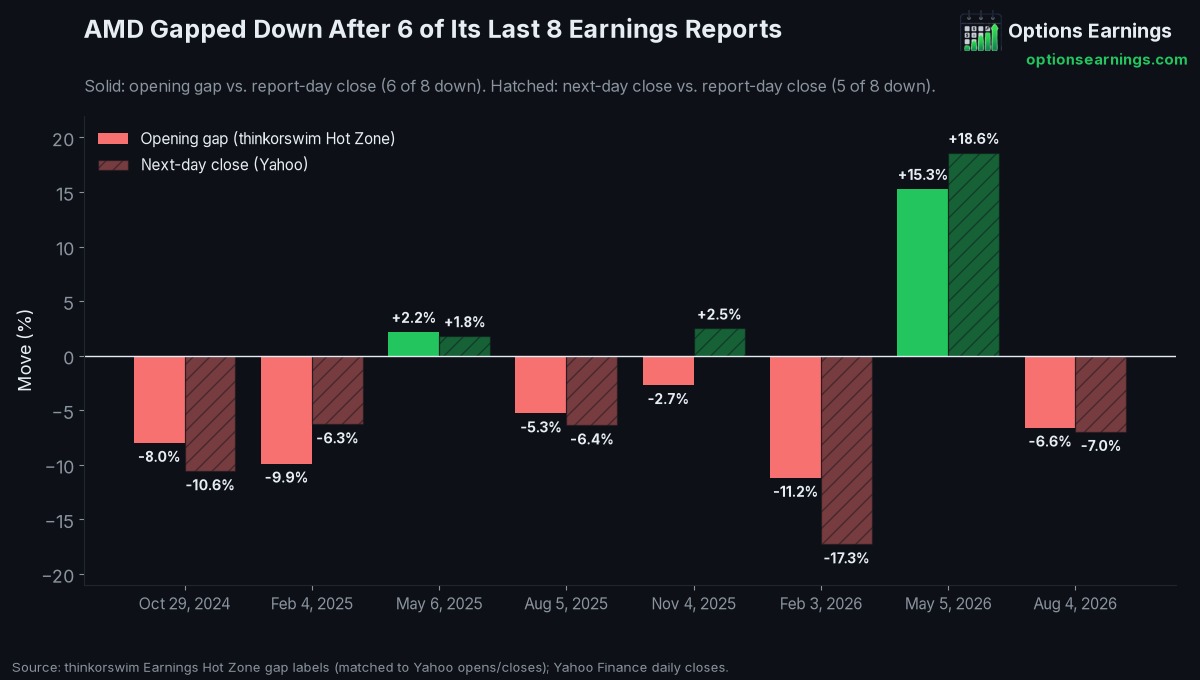
- Aug 4, 2026: gap -6.6%, next-day close -7.0%
- May 5, 2026: gap +15.3%, next-day close +18.6%
- Feb 3, 2026: gap -11.2%, next-day close -17.3%
- Nov 4, 2025: gap -2.7%, next-day close +2.5%
- Aug 5, 2025: gap -5.3%, next-day close -6.4%
- May 6, 2025: gap +2.2%, next-day close +1.8%
- Feb 4, 2025: gap -9.9%, next-day close -6.3%
- Oct 29, 2024: gap -8.0%, next-day close -10.6%
Opening gaps from my thinkorswim Earnings Hot Zone chart; next-day closes from Yahoo Finance. Both are measured from the report-day close.
Semis and the Nasdaq are sitting on the 200-day
Semis are the most important movers right now and are weighing on the Nasdaq, and both are sitting on the 200 SMA. This could be the best buy spot, if it holds.
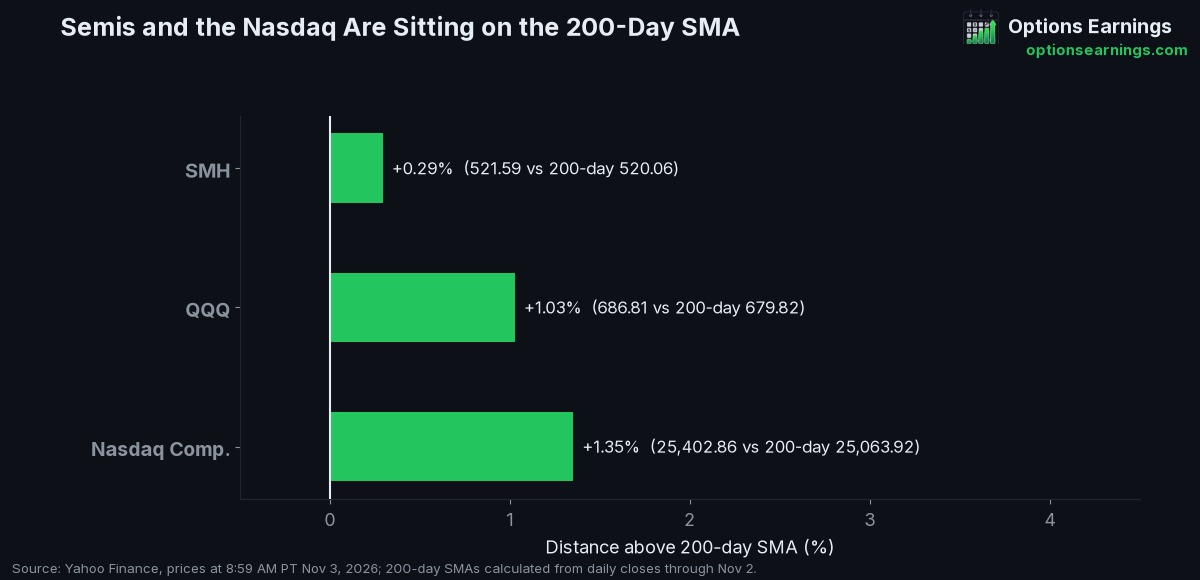
- SMH (the semiconductor ETF): $521.59 vs. its 200-day at $520.06
- QQQ: $686.81 vs. its 200-day at $679.82
- Nasdaq Composite: 25,402.86 vs. its 200-day at 25,063.92
Prices as of 8:59 AM PT on November 3 from Yahoo Finance; 200-day SMAs calculated from daily closes.
What I'm watching after the report
I think a lot of the panic and selling has been overdone, and I'm still a believer in the AI revolution. I'm going to keep buying stocks during this downturn, but I'm shorting companies that get hammered post-earnings. Any ticker that falls 1.5x to 2x its expected move or more is a short in my system. For AMD, that is a drop of $53.86 to $71.82 or more from today's close.
That momentum signal comes from the Earnings Hot Zone, the system my husband, Darrell Gum, and I built together. I'm so grateful for the work he put into it.
Watch the post-earnings move and the support zones to decide whether the stock will keep falling.
Get my weekly earnings watchlist
I write The Earnings Watchlist, my free newsletter that comes out every Monday with the top optionable stocks I'm eyeing that are reporting earnings, their expected moves and the levels I'm watching. Sign up for free here.
Disclosure: Long AMD stock, long SMH.