
Inside this article
- AAPL, PLTR & AMD lead the week
- Daily IV and expected-move snapshots
- Short-squeeze risk after the AI selloff
November 2 newsletter · Market snapshots are dated
From The Earnings Watchlist sent November 2, 2026. Market commentary, positions, IV, and expected moves reflect that edition’s stated snapshots; they are not live quotes.
Week in Review
Last week was the biggest week of earnings season, and the market punished anything that looked like an AI spending problem or a software slowdown. Magnificent 7 Earnings is historically the most volatile week of the quarter, but the earnings destruction moves this quarter were significant and caused the Nasdaq and the semiconductors (SMH) to experience their second worst days of 2026.
Why? Because multiple key names reported earnings and experienced destructive moves post-earnings, that were outside expected ranges. This is why it's critical to know what the expected ranges are going into the reports.
How I measure moves: each % is the closing price before the report to the first close after it (Yahoo Finance), and ⚡ marks a move of at least 1.5x the Options Earnings expected move.
Microsoft: the AI investment case
MSFT (Wednesday, October 28, after the close) beat, with adjusted EPS of $4.89 vs $4.73, revenue of $92.3B (+19%) and Azure +48%, and closed basically flat (−0.2%). The gap to new highs didn't hold, but the pattern is still constructive, with multiple squeezes, and it's in a buy zone. Microsoft proved its AI investments were worth it, and I see it as a continued buy up into $600. I'm planning on buying more.
Reported results: Microsoft FY2027 Q1.
Alphabet: growth without a constructive price reaction
GOOGL (Wednesday, October 28, after the close) was the opposite. Google Cloud grew an insane 103%, but almost everything else missed. Adjusted EPS was $2.67 vs $3.02, revenue was $127.58B vs $128.22B, and free cash flow came in at −$9.07B. It closed −12.6% (about 2.1x its ±$19.15 expected move ⚡), its worst day since its 2004 IPO, and broke the $300 support I was watching. This is the Earnings Destruction pattern: it went in stuck below the 200 SMA, and without a massive catalyst, selling takes hold. Google isn't a buy for me right now; I'm watching $250 as the first repair zone.
Reported results: Alphabet Q3 2026 filing.
Amazon: the levels I’m watching
AMZN (Thursday, October 29, after the close) missed on EPS ($1.89 vs $1.97) and revenue ($201.9B vs ~$202.2B, FactSet estimates via the AP), even with AWS up 39%. After hours, it was about 10% below Wednesday's close, but that included Thursday's regular-session drop before the report; from Thursday's close to Friday's close it fell 1.4%. The levels I'm watching are the 200 SMA at $243 and the $225–$226 double bottom. As of this November 2 newsletter, AMZN was already up about 4% off of the buy zone at $235 I mentioned on Charles Payne on Friday. I still own it and would buy down into $200, because short-term spending leads to long-term growth.
Reported results: Amazon Q3 2026.
I broke down the Mag 7 reports in my Five Star Trader market analysis.
Software, semiconductors, and other major reports
NOW and FTNT: Software got hit hardest. NOW missed on adjusted EPS ($1.00 vs $1.02) and gave a light guide, then closed −26.9% (3.1x ⚡), its worst day ever. FTNT beat and still closed −20.1% (2.1x ⚡) on a weak service-revenue outlook.
INTC (Thu AMC): Beat on adjusted EPS ($0.52 vs ~$0.40) with revenue in line at $16.5B, then closed −28.6% on a weak Q4 and PC outlook, its worst day since the 1970s. This Earnings Destruction setup was the Nasdaq killer of the week. Semis took a hard hit, and there are more critical reports to come this week from AMD, QCOM and ARM. Without repair from these names, semis may break further, causing more downside in the Nasdaq.
SNDK (Thu AMC): Revenue of $11.0B (+23% sequentially), adjusted EPS of $49.51 and a $12.2B–$12.6B revenue guide didn't stop the selling. It closed −13.5%, about 1.8x my ±$101 pre-report expected move ⚡. To me, expectations in memory got far too high. That doesn't make it a bad space; prices just needed to come down to give us a better opportunity to buy.
BA, V, ABBV: BA missed (core EPS −$0.34 vs −$0.21) and closed −10.7%, with the 737 ramp to 52 a month pushed to late 2027. V beat and barely moved (−0.3%). ABBV beat on both lines and closed +1.4%.
The earnings reaction scorecard
-
Beat and fell: RDDT −29.2%, INTC −28.6% (revenue in line), FTNT −20.1% (2.1x ⚡), RBLX −18.1% (revenue miss), TWLO −15.2%, SNDK −13.5% (1.8x ⚡), COIN −10.6% (revenue miss), CAT −9.3% (revenue miss), MSTR −7.8% (revenue miss), VZ −3.5% (revenue miss), HOOD −3.3% (revenue miss), SBUX −1.7% (revenue miss), KO −1.6%, TMUS −0.5%, V −0.3%, MSFT −0.2%
-
Beat and rose: VRT +16.5% (1.8x ⚡), SOFI +13.4%, REGN +13.3%, CLS +12.1%, AZN +7.0%, LLY +6.6%, RIVN +6.2%, UPS +5.8%, RCL +5.5% (revenue miss), KLAC +5.5%, MA +4.2%, MDLZ +3.9% (revenue miss), MRK +3.8%, GILD +3.1%, XOM +2.2%, PYPL +2.0% (revenue miss), CVX +1.8%, ABBV +1.4%, FDX +1.1% (revenue miss)
-
Missed and fell: NOW −26.9% (revenue beat, 3.1x ⚡), GOOGL −12.6% (2.1x ⚡), BA −10.7%, SYK −6.4% (revenue miss), PINS −2.8% (revenue miss), AMZN −1.4% (revenue miss)
-
Missed and rose: CVNA +15.7% (revenue beat), CMG +8.9% (revenue beat), CDNS +6.5% (revenue beat)
Once again, the beat didn't decide the direction: RDDT and INTC beat and lost close to 30%, while CMG and CVNA missed and rallied.
Moves of 1.5x–2x or more often lead to a post-earnings trade idea, and last week had plenty: NOW 3.1x, GOOGL 2.1x, FTNT 2.1x and SNDK 1.8x down, and VRT 1.8x up.
Read my latest earnings previews and post-earnings reviews.
This Week's Focus
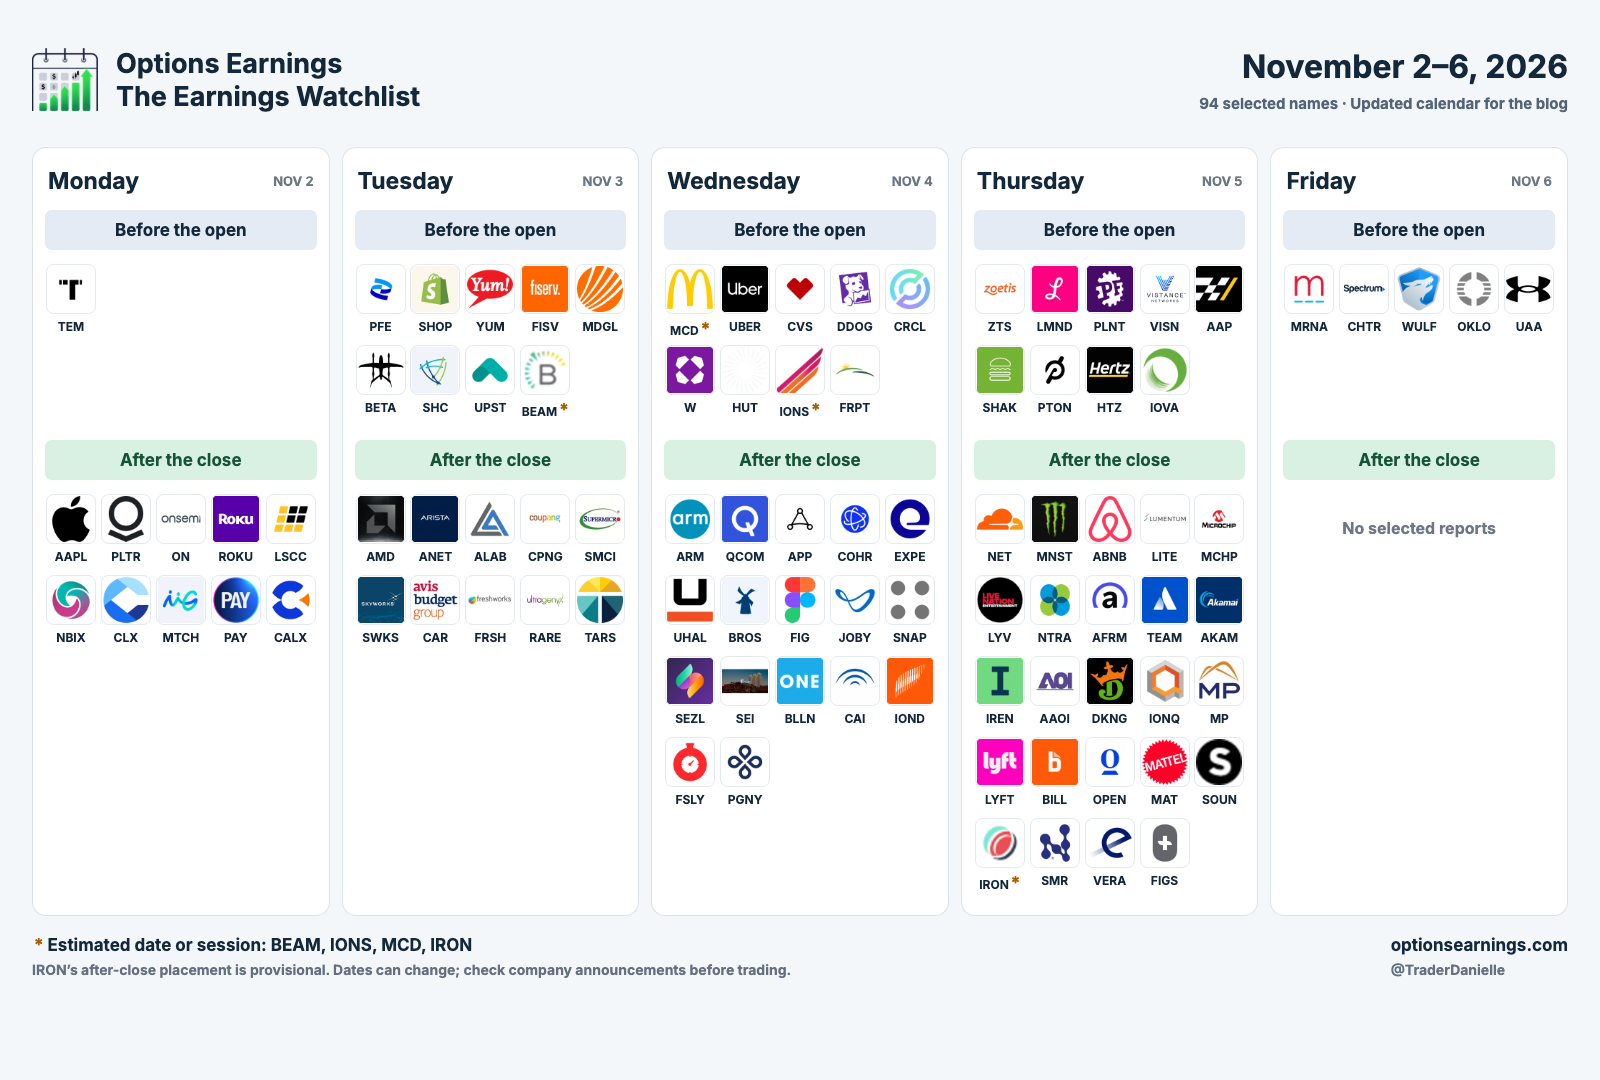
Calendar note: BEAM, IONS, MCD, and IRON remain estimated. IRON’s Thursday after-close placement is provisional. BMO means before the market opens; AMC means after the market closes. The calendar reflects this edition’s selected names.
Open or download the full-size November 2–6 earnings calendar. To create your own custom calendar, visit Options Earnings.
Already reported: TEM kicked off the week on Monday morning, November 2 with a beat and a raised full-year revenue guide, and it was up about 10% intraday as of 11:53 AM PT. This move fits into my new focus area of genetic testing and biotech names to watch. This ticker also has high short float.
Apple on Monday: Apple reports after the close on November 2, and it's the next big test for the Mag 7. I'm bullish on AAPL and the stock is strong, but after last week, any negative reaction of at least 1.5× its expected move—the expected move itself was about ±$13.66, or 4.1% would do further damage to the Nasdaq. I'm cautiously optimistic.
The calendar is focused on names with more usable options markets, plus some of the most heavily shorted names reporting.
Top Options Names by Day and Session
The IV and expected moves below are the snapshots published in my November 2 newsletter, refreshed around 11:30–11:40 AM PT while the market was open. They can change until each report. I ranked each session by options activity and liquidity, using options volume where available, otherwise at-the-money open interest, plus company size and how much my readers trade the name.
Monday, Nov 2
Before the open
- TEM (Mon BMO), already reported: Beat on both lines: adjusted EPS of $0.07 vs a ~$0.09 loss expected, revenue of $411.5M (+23%) vs ~$409.4M, and adjusted EBITDA of $25.6M. It raised its full-year revenue guide to $1.60–$1.605B. Up 10.3% intraday as of 11:53 AM PT ($79.63 vs Friday's $72.22 close), about 0.9x its ±$8.10 expected move, so there's no momentum signal yet (this isn't a closing price).
Reported results: Tempus Q3 2026 filing. Adjusted EBITDA was also positive in Q3 2025; this was not its first positive quarter.
After the close
-
AAPL (Mon AMC): 56.7% IV, ±$13.66 (~4.1%) expected move. Apple has beaten EPS estimates 8 quarters in a row.
-
PLTR (Mon AMC): 149.7% IV, ±$19.49 (~10.7%) expected move. Last quarter it closed up 29.5% the day after earnings, on 93% revenue growth.
-
ON (Mon AMC): 121.1% IV, ±$6.14 (~8.6%) expected move. ON has beaten EPS 4 straight quarters, and it's the first chip read after INTC's −28.6%.
Tuesday, Nov 3
Before the open
-
SHOP (Tue BMO): 165.0% IV, ±$18.51 (~11.8%) expected move. Last quarter it closed up 17.0% on earnings day.
-
PFE (Tue BMO): 54.1% IV, ±$1.20 (~3.9%) expected move. Pfizer has beaten EPS 8 quarters in a row, by an average of about 22%.
-
UPST (Tue BMO): 152.5% IV, ±$2.62 (~11.2%) expected move. With 31.6% of the float short and two straight EPS misses, this is a squeeze-or-flush setup.
After the close
-
AMD (Tue AMC): 123.6% IV, ±$41.62 (~8.8%) expected move. It's the biggest AI chip report of the week, the day before ARM and QCOM.
-
ANET (Tue AMC): 117.8% IV, ±$13.73 (~8.4%) expected move. Arista has beaten EPS 8 quarters in a row.
-
SMCI (Tue AMC): 168.0% IV, ±$3.66 (~12.0%) expected move. After its August report, it closed up 19.0% the next day.
Wednesday, Nov 4
Before the open
-
UBER (Wed BMO): 92.8% IV, ±$4.44 (~6.7%) expected move. Last quarter a soft profit guide sent it down 5.3% on earnings day.
-
MCD (Wed BMO, estimated): 43.7% IV, ±$8.27 (~3.1%) expected move. Last quarter it rose only 1.2% after U.S. same-store sales grew just 0.8%.
-
DDOG (Wed BMO): 184.0% IV, ±$28.80 (~13.1%) expected move. Last quarter it beat and raised guidance, and still closed down 19.0% on earnings day.
After the close
-
ARM (Wed AMC): 141.0% IV, ±$19.91 (~10.0%) expected move. In July it dropped after hours, then closed up 7.4% the next day. The first reaction isn't always the real one.
-
QCOM (Wed AMC): 109.5% IV, ±$12.73 (~7.8%) expected move. A weak profit guide in July sent it down 2.6% the next day.
-
SNAP (Wed AMC): 166.2% IV, ±$0.65 (~11.8%) expected move. Last quarter it closed up 14.9% the day after its revenue beat.
Thursday, Nov 5
Before the open
-
ZTS (Thu BMO): 58.6% IV, ±$7.57 (~9.2%) expected move. In August it cut guidance, dipped premarket, and still closed up 3.9%. (Priced on the Nov 20 expiration, since there's no weekly.)
-
HTZ (Thu BMO): 234.7% IV, ±$0.33 (~17.1%) expected move. At 73.3% short float, it's the most heavily shorted name on my calendar.
-
LMND (Thu BMO): 176.0% IV, ±$5.21 (~12.6%) expected move. Lemonade has beaten EPS estimates 8 quarters in a row, with 16.4% of the float short.
After the close
-
NET (Thu AMC): 178.9% IV, ±$33.87 (~12.7%) expected move. Last quarter it was up as much as 17% after hours but closed only +5.6%.
-
ABNB (Thu AMC): 90.5% IV, ±$11.13 (~6.5%) expected move. Last quarter it closed up 17.4% at a four-year high.
-
DKNG (Thu AMC): 110.4% IV, ±$1.73 (~7.9%) expected move. In August it missed and still closed up 8.4% on prediction-market growth.
Friday, Nov 6
Before the open
-
MRNA (Fri BMO): 118.7% IV, ±$18.70 (~8.5%) expected move. Moderna has beaten EPS estimates 8 quarters in a row.
-
OKLO (Fri BMO): 142.5% IV, ±$2.40 (~10.1%) expected move. It goes into the print with 21.9% of the float short.
-
WULF (Fri BMO): 191.5% IV, ±$1.50 (~13.6%) expected move. With 30.2% short float, it's one of the most shorted names reporting this week.
-
Friday after the close: no notable earnings in this selected calendar.
Short-squeeze risk
Squeeze-risk watch (heavily shorted names reporting this week): CAR 47.2%, SOUN 41.9%, BEAM 39.3% (earnings date estimated), WULF 30.2%, AAP 28.9%, SEI 26.2%, OPEN 26.1%, SMR 24.9% short float (Yahoo Finance, short interest as of Oct 15). The Options Earnings feed also shows HTZ at 73.3%, BROS at 49.1% and UPST at 31.6%. Heavily shorted names can move far outside the expected move in either direction, so size accordingly.
Big-Picture Takeaways for Options Traders
-
Tickers most likely to create high volatility this week include AAPL, PLTR, AMD, ARM, QCOM, NET, AFRM, DKNG and heavily shorted names like CAR, SOUN and BEAM.
-
AI spending is being judged on free cash flow, not just growth. GOOGL fell 12.6% with Cloud +103%. Watch how AAPL, AMD, ANET and ARM talk about spending and margins.
-
Beats didn't protect stocks last week (RDDT, INTC, FTNT), and misses didn't sink them (CMG, CVNA). Compare the reaction to the expected move and key support and resistance, not to the headline beat.
-
**Want my full overview on a ticker this week? Email me the ticker, or browse my latest reviews.
Your Earnings Tool
To learn more about the tickers reporting earnings, go to Options Earnings and click an individual ticker to open its preview. There, you’ll find the current stock price, three-month price action, expected moves in the options market, implied volatility, earnings premium, short float, and more.
Happy Trading!
Disclosure: Danielle Shay owns shares of MSFT and AMZN.